Brighthouse Financial, [BHFAL]
Exchange: NASDAQ Sector: Industrials
Brighthouse Financial, Price, Forecast, Insider, Ratings, Fundamentals & Signals
1.01% $22.96
America/New_York / 23 apr 2024 @ 16:00
| FUNDAMENTALS | |
|---|---|
| MarketCap: | 3 115.34 mill |
| EPS: | -4.86 |
| P/E: | -4.73 |
| Earnings Date: | Mar 30, 2023 |
| SharesOutstanding: | 135.69 mill |
| Avg Daily Volume: | 0.0240 mill |
| RATING 2024-04-23 |
|---|
| B- |
| Sell |
| RATINGS | ||
|---|---|---|
| Rating CashFlow: | Strong Buy | |
| Return On Equity: | Strong Sell | |
| Return On Asset: | Strong Sell | |
| DE: | Buy | |
| P/E: | Strong Sell | |
| Price To Book: | Sell |
| QUARTER GROWTHS | ||||||
|---|---|---|---|---|---|---|
| 3/22 | 4/22 | 1/23 | 2/23 | 3/23 | 4/23 | |
| Revenue | ||||||
| Gr.Profit | ||||||
| Ebit | ||||||
| Asset | ||||||
| Debt | n/a |
| PE RATIO: COMPANY / SECTOR |
|---|
| 0.00x |
| Company: PE -4.73 | sector: PE 11.29 |
| PE RATIO: COMPANY / INDUSTRY |
|---|
| -0.27x |
| Company: PE -4.73 | industry: PE 17.27 |
| DISCOUNTED CASH FLOW VALUE |
|---|
|
$77.50 (237.54%) $54.54 |
| Date: 2024-04-23 |
| Expected Trading Range (DAY) |
|---|
|
$ 22.54 - 23.38 ( +/- 1.82%) |
| ATR Model: 14 days |
Insider Trading
| Date | Person | Action | Amount | type |
|---|---|---|---|---|
| 2023-10-02 | Toscano Kristine | Buy | 1 708 | Common Stock |
| 2023-10-02 | Toscano Kristine | Sell | 726 | Common Stock |
| 2023-10-02 | Toscano Kristine | Sell | 1 708 | Restricted Stock Units |
| 2023-06-08 | Hooley Stephen C | Buy | 3 361 | Deferred Restricted Stock Units |
| 2023-06-08 | Hooley Stephen C | Buy | 3 703 | Restricted Stock Units |
| INSIDER POWER |
|---|
| 25.94 |
| Last 88 transactions |
| Buy: 406 882 | Sell: 239 952 |
Forecast:
16:00 - $22.78
Live Trading Signals (every 1 min)
Forecast
1: 16:00 - $22.78
Forecast 2: 16:00 - $22.78
Forecast 3: 16:00 - $22.78
SCORE
10.00
Buy
10.00
Buy
Score Algorithm Version: 1.2C
Last version updated: Fri April 15th, 2022
Last version updated: Fri April 15th, 2022
| Indicator Signals | |
|---|---|
| RSI 21 | |
| SMA | |
| Trend | |
| Trend 2 | |
| Trend 3 | |
| MACD |
| Volume Signals | |
|---|---|
| Price | $22.96 (1.01% ) |
| Volume | 0.0434 mill |
| Avg. Vol. | 0.0240 mill |
| % of Avg. Vol | 180.76 % |
| Signal 1: | |
| Signal 2: |
Today
Last 12 Months
RSI
Last 10 Buy & Sell Signals For BHFAL
0 Signals | Accuracy: 0.00% | Accuracy Buy: 0.00% | Accuracy Sell: 0.00%
Avg return buy: 0.00 % | Avg return sell: 0.00 %
$1 invested is now $1.00 or 0.00% since Coming Soon
| Date | Signal | @ | Closed | % |
|---|

Latest Press Releases
2020-02-10 21:17:00 - Press Release
Brighthouse Financial To Host Business Update Conference Call
Charlotte, n.c.--(business wire)--brighthouse financial, inc. (“brighthouse financial” or the “company”) (nasdaq: bhf) announced today that it plans to hold a business update conference call and audio webcast for investors and analysts from 8:00 a.m. to 9:30 a.m. eastern time on thursday, march 5, 2020. presenters will include members of brighthouse financial’s senior management team. prior to the call, the company will make available on the brighthouse financial investor relations web page a p
2020-02-10 21:16:00 - Press Release
Brighthouse Financial Announces Fourth Quarter And Full Year 2019 Results
Charlotte, n.c.--(business wire)--brighthouse financial, inc. ("brighthouse financial" or the "company") (nasdaq: bhf) announced today its financial results for the fourth quarter and full year ended december 31, 2019. fourth quarter and full year 2019 results the company reported a net loss available to shareholders of $1,077 million in the fourth quarter of 2019, or $10.02 per diluted share, compared with net income available to shareholders of $1,442 million in the fourth quarter of 2018. during the quarter, as a result of strong equity markets and rising interest rates, the value of our hedges, which the company uses to protect its balance sheet against adverse market conditions, decreased, as expected, while corresponding liabilities under u...
2020-02-10 21:15:00 - Press Release
Brighthouse Financial Announces $500 Million Stock Repurchase Program
Charlotte, n.c.--(business wire)--brighthouse financial, inc. (“brighthouse financial” or the “company”) (nasdaq: bhf) announced today that it has authorized the repurchase of up to $500 million of brighthouse financial common stock. the stock repurchase program is in addition to the $600 million aggregate stock repurchase authorizations announced in may 2019 and august 2018. since the announcement of the company’s first stock repurchase authorization in august 2018, the company has repurchased
2019-12-17 21:27:00 - Press Release
Am Best Affirms Credit Ratings Of Brighthouse Financial, Inc. And Its Subsidiaries
Oldwick, n.j.--(business wire)--am best has affirmed the financial strength rating (fsr) of a (excellent) and the long-term issuer credit ratings (long-term icr) of “a+” of brighthouse life insurance company (wilmington, de), the largest operating entity for the brighthouse group of companies, new england life insurance company (boston, ma) and brighthouse life insurance company of ny (new york, ny), the new york-based insurance subsidiary. these entities collectively are referred to as brighth
Latest News
2023-11-08 10:01:04 - Seeking Alpha
Brighthouse Financial, Inc. (BHF) Q3 2023 Earnings Call Transcript
Brighthouse Financial, Inc. (NASDAQ:BHF ) Q3 2023 Earnings Conference Call November 8, 2023 8:00 AM ET Company Participants Dana Amante - Head of IR Eric T. Steigerwalt - President and CEO Edward Spehar - EVP and CFO John L.
2023-02-10 11:33:05 - Seeking Alpha
Brighthouse Financial, Inc. (BHF) Q4 2022 Earnings Call Transcript
Brighthouse Financial, Inc. (NASDAQ:BHF ) Q4 2022 Results Conference Call February 10, 2023 8:00 AM ET Company Participants Dana Amante - Head of IR Eric Steigerwalt - President, CEO and Director Ed Spehar - Executive VP and CFO Myles Lambert - Executive VP and Chief Distribution and Marketing Officer John Rosenthal - Executive VP and CIO Conference Call Participants Elyse Greenspan - Wells Fargo Tracy Benguigui - Barclays Ryan Kruger - KBW Suneet Kamath - Jefferies John Barnidge - Piper Sandler Tom Gallagher - Evercore ISI Erik Bass - Autonomous Research Alex Scott - Goldman Sachs Operator Good morning, ladies and gentlemen, and welcome to the Brighthouse Financial Fourth Quarter and Full Year 2022 Earnings Conference Call...
2022-11-08 09:32:03 - Seeking Alpha
Brighthouse Financial, Inc. (BHF) Q3 2022 Earnings Call Transcript
Brighthouse Financial, Inc. (NASDAQ:BHF ) Q3 2022 Earnings Conference Call November 8, 2022 8:00 AM ET Company Participants Dana Amante - Head of Investor Relations Eric Steigerwalt - President & Chief Executive Officer Ed Spehar - Chief Financial Officer Myles Lambert - Executive Vice President & Chief Distribution & Marketing Officer Conference Call Participants Erik Bass - Autonomous Ryan Krueger - KBW Elyse Greenspan - Wells Fargo John Barnidge - Piper Sandler Suneet Kamath - Jefferies Tracy Benguigui - Barclays Alex Scott - Goldman Sachs Thomas Gallagher - Evercore ISI Operator Good morning, ladies and gentlemen, and welcome to the Brighthouse Financial's Third Quarter 2022 Earnings Conference Call...
2022-08-05 11:46:19 - Seeking Alpha
Brighthouse Financial, Inc. (BHF) CEO Eric Steigerwalt on Q2 2022 Results - Earnings Call Transcript
Brighthouse Financial, Inc. (NASDAQ:BHF ) Q2 2022 Earnings Conference Call August 5, 2022 8:00 AM ET Company Participants Dana Amante - Head of Investor Relations Eric Steigerwalt - President and Chief Executive Officer Ed Spehar - Chief Financial Officer John Rosenthal - CIO Myles Lambert - Head of Marketing Conference Call Participants Elyse Greenspan - Wells Fargo Tracy Benguigui - Barclays Erik Bass - Autonomous John Barnidge - Piper Sandler Ryan Krueger - KBW Alex Scott - Goldman Sachs Tom Gallagher - Evercore ISI Sunnet Kamath - Jefferies Operator Good morning, ladies and gentlemen, and welcome to Brighthouse Financial's Second Quarter 2022 Earnings Conference Call. My name is Shannon, and I will be the coordinator today.
2022-05-10 10:18:16 - Seeking Alpha
Brighthouse Financial, Inc. (BHF) CEO Eric Steigerwalt on Q1 2022 Results - Earnings Call Transcript
Brighthouse Financial, Inc. (NASDAQ:BHF ) Q1 2022 Results Earnings Conference Call May 10, 2022 8:00 AM ET Company Participants Dana Amante - Head, Investor Relations Eric Steigerwalt - President and Chief Executive Officer Ed Spehar - Chief Financial Officer Myles Lambert - Head, Marketing Conference Call Participants Ryan Krueger - KBW Elyse Greenspan - Wells Fargo Erik Bass - Autonomous Research Tracy Benguigui - Barclays Alex Scott - Goldman Sachs Tom Gallagher - Evercore Suneet Kamath - Jefferies Operator Good morning, ladies and gentlemen and welcome to Brighthouse Financial's First Quarter 2022 Earnings Conference Call. My name is Kevin, I'll be your coordinator today.
2020-08-31 18:49:00 - seekingalpha.com
Welcome To Brighthouse
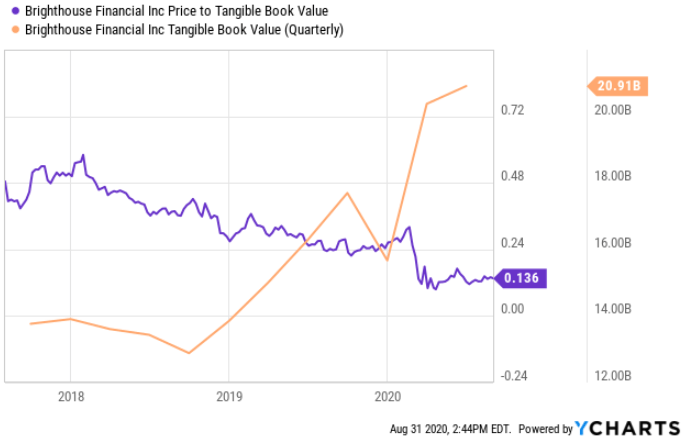
GAAP reporting and the opacity of the variable annuity business make this Brighthouse Financial Inc. hard to analyze and value.
2020-07-13 07:03:40 - seekingalpha.com
The R.I.P. Portfolio's Q2 2020 Update

This real-money portfolio was first introduced to the Seeking Alpha community in December 2015. The portfolio underperformed its benchmark in Q2 2020 and it is lagging the S&P 500's performance since late 2015.
2020-07-12 12:38:19 - seekingalpha.com
Highest Yielding 'Investment Grade' Preferred Stocks With Qualified Dividends
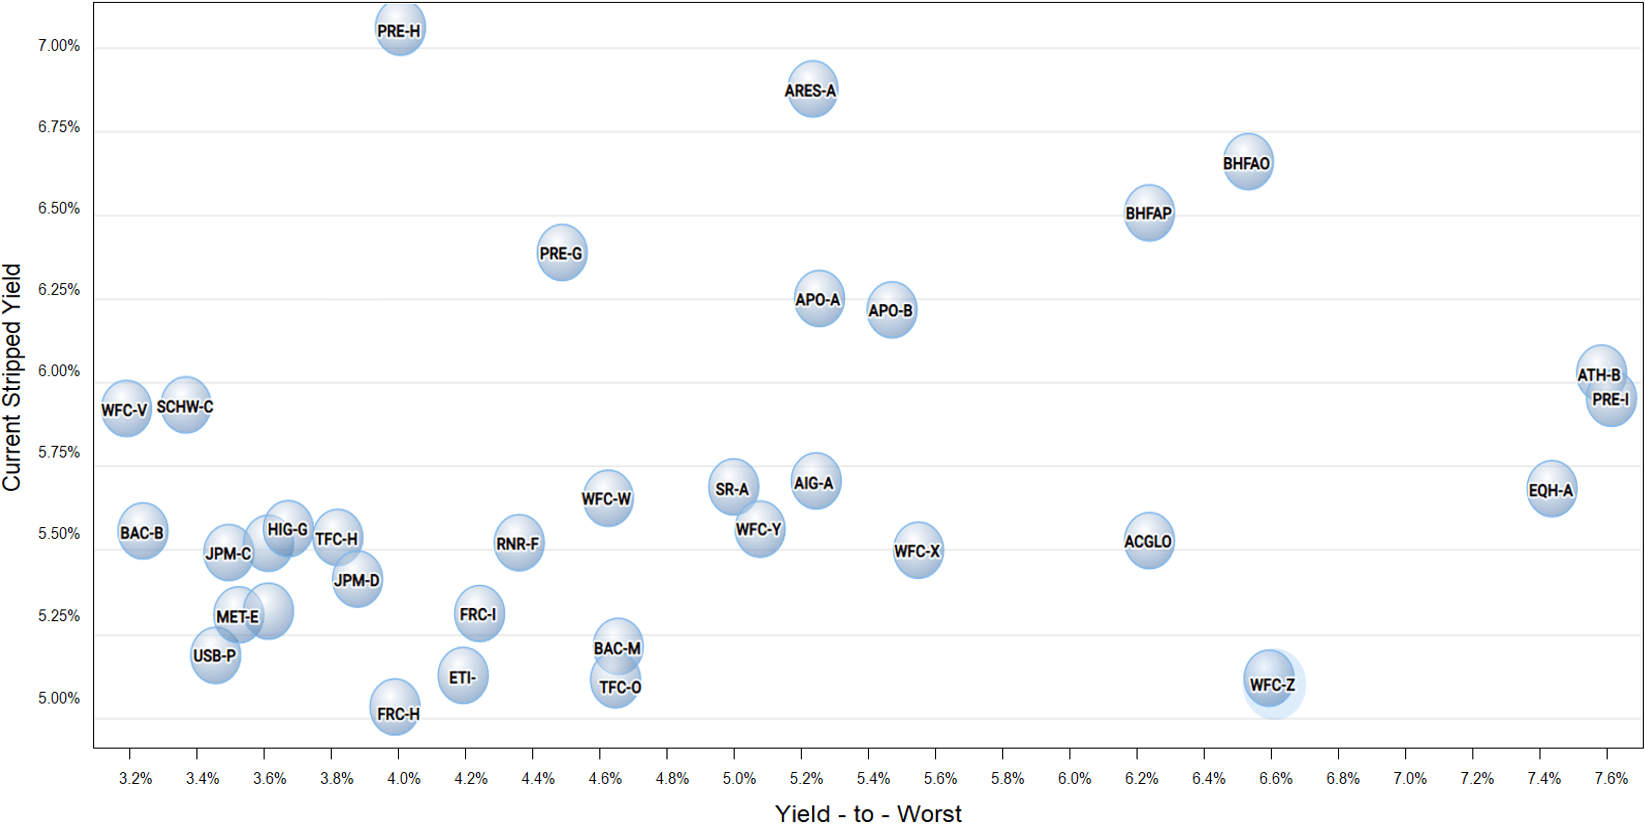
This article is for those who are concerned with the current economic landscape and are looking for relatively high after-tax yields but also want high quality.
2020-04-17 13:35:48 - SEEKINGALPHA
The R.I.P. Portfolio's Q1 2020 Update
This real-money portfolio was first introduced to the Seeking Alpha community in December 2015. The portfolio underperformed its benchmark in Q1 2020 and it is
2020-03-13 15:50:10 - Zacks Investment Research
Are Investors Undervaluing Brighthouse Financial (BHF) Right Now?

Here at Zacks, our focus is on the proven Zacks Rank system, which emphasizes earnings estimates and estimate revisions to find great stocks. Nevertheless, we are always paying attention to the latest value, growth, and momentum trends to underscore strong picks.