First Trust S&P [FID]
Exchange: NASDAQ
First Trust S&P Price, Forecast, Insider, Ratings, Fundamentals & Signals
-0.45% $15.51
America/New_York / 24 apr 2024 @ 16:00
| FUNDAMENTALS | |
|---|---|
| MarketCap: | 78.81 mill |
| EPS: | 1.455 |
| P/E: | 10.66 |
| Earnings Date: | N/A |
| SharesOutstanding: | 5.08 mill |
| Avg Daily Volume: | 0.0219 mill |
| PE RATIO: COMPANY / SECTOR |
|---|
| 0.73x |
| Company: PE 10.66 | sector: PE 14.70 |
| PE RATIO: COMPANY / INDUSTRY |
|---|
| 0.62x |
| Company: PE 10.66 | industry: PE 17.27 |
| DISCOUNTED CASH FLOW VALUE |
|---|
| N/A |
| N/A |
| Expected Trading Range (DAY) |
|---|
|
$ 15.38 - 15.64 ( +/- 0.84%) |
| ATR Model: 14 days |
Forecast:
16:00 - $15.52
Live Trading Signals (every 1 min)
Forecast
1: 15:07 - $15.49
Forecast 2: 15:57 - $15.51
Forecast 3: 16:00 - $15.52
SCORE
10.00
Buy
10.00
Buy
Score Algorithm Version: 1.2C
Last version updated: Fri April 15th, 2022
Last version updated: Fri April 15th, 2022
| Indicator Signals | |
|---|---|
| RSI 21 | |
| SMA | |
| Trend | |
| Trend 2 | |
| Trend 3 | |
| MACD |
| Volume Signals | |
|---|---|
| Price | $15.51 (-0.45% ) |
| Volume | 0.0092 mill |
| Avg. Vol. | 0.0219 mill |
| % of Avg. Vol | 41.97 % |
| Signal 1: | |
| Signal 2: |
Today
Last 12 Months
RSI
Last 10 Buy & Sell Signals For FID
0 Signals | Accuracy: 0.00% | Accuracy Buy: 0.00% | Accuracy Sell: 0.00%
Avg return buy: 0.00 % | Avg return sell: 0.00 %
$1 invested is now $1.00 or 0.00% since Coming Soon
| Date | Signal | @ | Closed | % |
|---|

FID
Under normal conditions, the fund will invest at least 90% of its net assets (including investment borrowings) in the equity securities that comprise the index. The index measures the performance of high dividend yielding companies that have followed a managed-dividends policy of increasing or maintaining dividends for at least ten consecutive years.
Last 10 Buy Signals
Latest News
2023-01-04 12:00:16 - Seeking Alpha
10 Top Dividend Aristocrat Stocks To Buy In 2023 - Our Favorite Is Singapore Technologies Engineering

"Dividend Aristocrats" is an S&P term for stocks that have raised their annual dividend every year for many years, 25 in the US or 10 internationally. As a strategy, investing in dividend aristocrats is backwards-looking, but does a decent job of screening companies with some quality earning power.
2022-10-08 01:56:04 - Seeking Alpha
FID: Lackluster Dividend Aristocrat ETF

FID is an ex-U.S global dividend fund with a yield of 4.8%. Canada is the top country in its portfolio.
2022-07-18 04:07:01 - Seeking Alpha
FID: Beneath-The-Surface FX Risks Might Dent Returns

FID invests in non-U.S. dividend aristocrats or stocks with no less than 10-year dividend growth (stability) stories. Since the index change, FID has delivered a surprisingly strong performance, even outperforming its peer WDIV over certain relevant periods.
2020-07-02 06:19:00 - https://www.thelincolnianonline.com
Jane Street Group LLC Has $381,000 Stock Position in First Trust S&P International Dividend Aristocrats ETF (NYSEARCA:FID)
Jane Street Group LLC lowered its stake in First Trust S&P International Dividend Aristocrats ETF (NYSEARCA:FID) by 8.0% during the first quarter, according to the company in its most recent Form 13F filing with the SEC. The fund owned 29,725 shares of the company’s stock after selling 2,568 shares during the quarter. Jane Street Group […]
2020-06-29 07:43:33 - seekingalpha.com
The Reopening Killed The V-Shaped Recovery
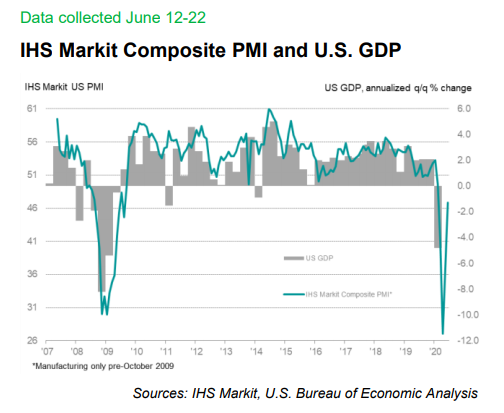
This is a weekly series focused on analyzing the previous week’s economic data releases. The objective is to concentrate on leading indicators of economic activ
2020-05-12 16:24:32 - https://www.etf.com
FRI

Learn everything about First Trust S&P REIT Index Fund (FRI). Free ratings, analyses, holdings, benchmarks, quotes, and news.
2020-02-23 07:00:01 - SEEKINGALPHA
Looking For Yield - Meet The Blues Brothers
Coronavirus is infecting the bond markets. This could take yields down to places that have not been seen in recent memory. Last year the equity markets provided
2019-12-11 14:40:02 - Yahoo
Dividend ETF (FID) Hits New 52-Week High
2019-09-24 21:27:00 - Yahoo
First Trust Advisors L.P. Announces Distributions for Exchange-Traded Funds
First Trust Advisors L.P. announces the declaration of distributions for 129 exchange-traded funds advised by FTA.
2019-08-16 12:00:12 - Yahoo
5 High-Dividend ETFs Available Under $20