Duke Energy Corporation [DUKB]
Exchange: NYSE Sector: Industrials
Duke Energy Corporation Price, Forecast, Insider, Ratings, Fundamentals & Signals
-0.37% $24.19
America/New_York / 8 mai 2024 @ 15:59
| FUNDAMENTALS | |
|---|---|
| MarketCap: | 78 597 mill |
| EPS: | 0 |
| P/E: | 0 |
| Earnings Date: | Mar 30, 2023 |
| SharesOutstanding: | 3 249.15 mill |
| Avg Daily Volume: | 0.0276 mill |
| RATING 2024-05-08 |
|---|
| B- |
| Neutral |
| RATINGS | ||
|---|---|---|
| Rating CashFlow: | Neutral | |
| Return On Equity: | Neutral | |
| Return On Asset: | Sell | |
| DE: | Buy | |
| P/E: | Sell | |
| Price To Book: | Strong Sell |
| QUARTER GROWTHS | ||||||
|---|---|---|---|---|---|---|
| 4/22 | 1/23 | 2/23 | 3/23 | 4/23 | 1/24 | |
| Revenue | ||||||
| Gr.Profit | ||||||
| Ebit | ||||||
| Asset | ||||||
| Debt |
| PE RATIO: COMPANY / SECTOR |
|---|
| 0.00x |
| Company: PE 0 | sector: PE 26.24 |
| PE RATIO: COMPANY / INDUSTRY |
|---|
| N/A |
| Company: PE 0 | industry: PE 13.52 |
| DISCOUNTED CASH FLOW VALUE |
|---|
| N/A |
| N/A |
| Expected Trading Range (DAY) |
|---|
|
$ 23.95 - 24.43 ( +/- 0.98%) |
| ATR Model: 14 days |
Insider Trading
| Date | Person | Action | Amount | type |
|---|---|---|---|---|
| 2023-12-18 | Kesner Idalene Fay | Buy | 322 | Director Savings Plan Restricted Stock Unit Deferrals |
| 2023-11-21 | Ghartey-tagoe Kodwo | Sell | 2 500 | Common Stock |
| 2023-11-20 | Gillespie Thomas Preston Jr. | Sell | 350 | Common Stock |
| 2023-10-03 | Kesner Idalene Fay | Buy | 364 | Director Savings Plan Restricted Stock Unit Deferrals |
| 2023-08-18 | Craver Theodore F Jr | Buy | 1 784 | Common Stock |
| INSIDER POWER |
|---|
| 39.44 |
| Last 100 transactions |
| Buy: 352 824 | Sell: 145 450 |
Forecast:
16:00 - $24.19
Live Trading Signals (every 1 min)
Forecast
1: 16:00 - $24.19
Forecast 2: 16:00 - $24.19
Forecast 3: 16:00 - $24.19
SCORE
10.00
Buy
10.00
Buy
Score Algorithm Version: 1.2C
Last version updated: Fri April 15th, 2022
Last version updated: Fri April 15th, 2022
| Indicator Signals | |
|---|---|
| RSI 21 | |
| SMA | |
| Trend | |
| Trend 2 | |
| Trend 3 | |
| MACD |
| Volume Signals | |
|---|---|
| Price | $24.19 (-0.37% ) |
| Volume | 0.0355 mill |
| Avg. Vol. | 0.0276 mill |
| % of Avg. Vol | 128.49 % |
| Signal 1: | |
| Signal 2: |
Today
Last 12 Months
RSI
Last 10 Buy & Sell Signals For DUKB
0 Signals | Accuracy: 0.00% | Accuracy Buy: 0.00% | Accuracy Sell: 0.00%
Avg return buy: 0.00 % | Avg return sell: 0.00 %
$1 invested is now $1.00 or 0.00% since Coming Soon
| Date | Signal | @ | Closed | % |
|---|

Latest Press Releases
2020-02-27 19:00:00 - Press Release
Duke Energy Awards $28,500 To Six Indiana Economic Development Groups For Its Foreign Direct Investment Partnership Program
Plainfield, ind., feb. 27, 2020 /prnewswire/ -- duke energy has awarded a total of $28,500 to six indiana economic development organizations to receive foreign direct investment partnership program grants. each organization was awarded up to $5,000. "we have to cultivate successful…
2020-02-27 16:00:00 - Press Release
Duke Energy Awards $114,500 In Marketing Partnership Program Grants To 24 Indiana Economic Development Groups
Plainfield, ind., feb. 27, 2020 /prnewswire/ -- duke energy has awarded $114,500 to 24 indiana economic development groups for the 2020 marketing partnership program. each program was awarded up to $5,000. "again this year, local and regional economic development groups can take advantage…
2020-02-13 12:00:00 - Press Release
Duke Energy Reports Fourth-quarter And Year-end 2019 Financial Results
Charlotte, n.c., feb. 13, 2020 /prnewswire/ -- duke energy (nyse: duk) has posted its fourth-quarter and year-end 2019 financial results in a news release available on the company's website at the following link: duke-energy.com/investors. lynn good, chairman, president and chief…
2020-02-07 23:17:00 - Press Release
Duke Energy Restores Power To 380,000 Carolinas Customers Following Powerful Two-day Storm
Charlotte, n.c., feb. 7, 2020 /prnewswire/ -- duke energy crews have restored power to more than 380,000 of the nearly 461,000 customers impacted by a powerful two-day storm that included tornadoes, heavy winds and record rainfall across the carolinas. a total of 49,000 customers – 37,000…
2020-02-05 22:04:00 - Press Release
Duke Energy Statement On Coal Ash Settlement Approval
Charlotte, n.c., feb. 5, 2020 /prnewswire/ -- duke energy today issued the following statement after receiving final approval of the company's agreement with the state regulator and the environmental community on how to permanently close all remaining ash basins in north carolina. north…
Latest News
2020-09-12 14:41:38 - seekingalpha.com
Dividend Champion And Contender Highlights: Week Of September 13

A weekly summary of dividend activity for Dividend Champions and Contenders. Companies which changed their dividends.
2020-09-06 16:07:59 - seekingalpha.com
Rotating Into Value For The Remainder Of 2020

Growth has massively outpaced value for nearly the last decade. This trend may well continue into the future, but its definitely not a straight line.
2020-09-05 09:00:00 - seekingalpha.com
What Insiders Have To Say About This All-Time High - August 2020 Insider Update
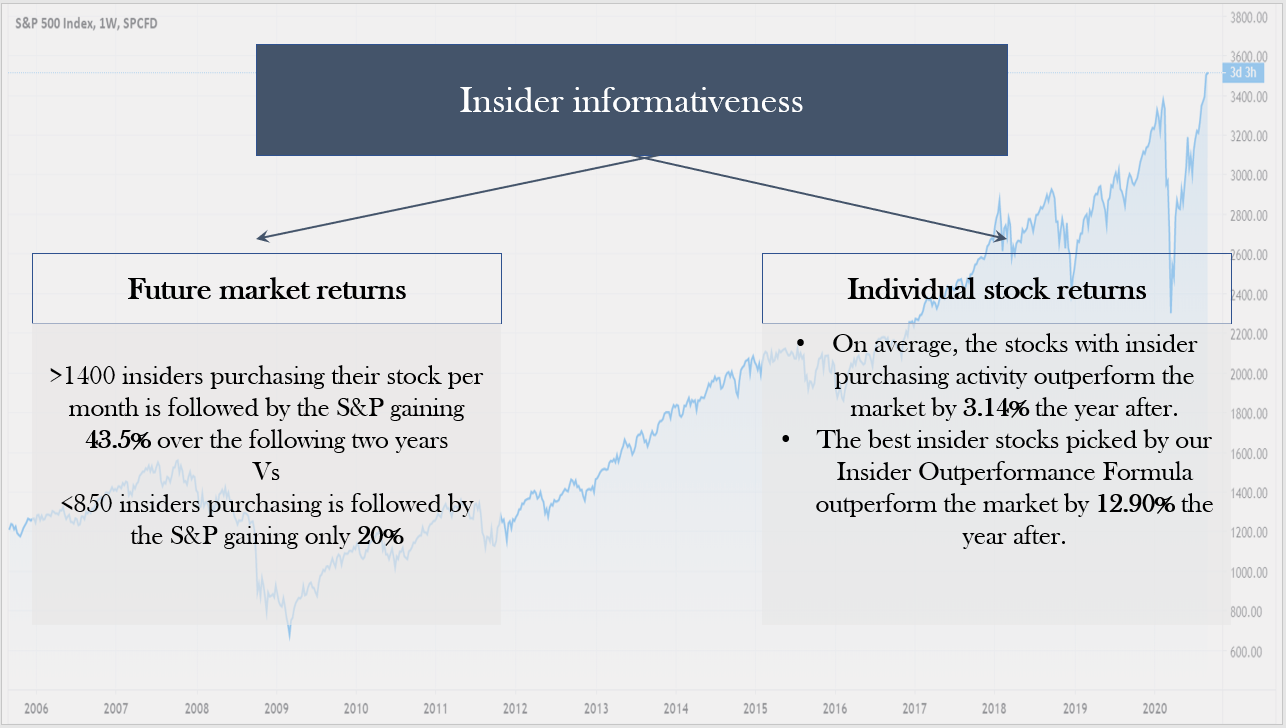
Insider activity is very informative to follow up for two reasons: it can help predict future market movements and it can be interesting to find undervalued stocks.
2020-09-02 13:21:17 - seekingalpha.com
Renewable Energy Is Set For Exponential Growth In The Years Ahead
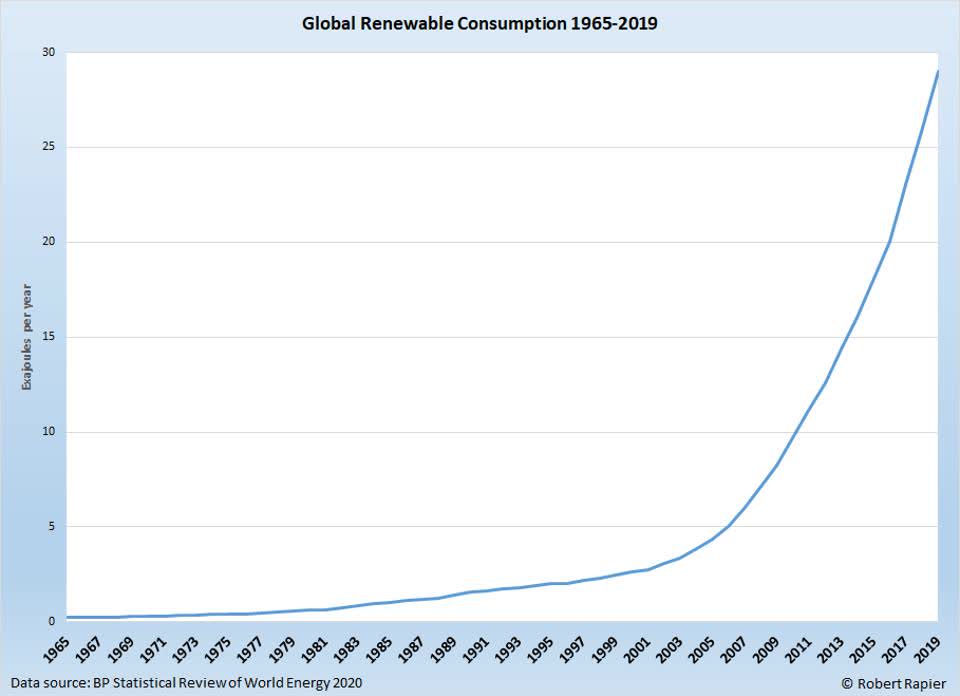
The world is changing right before our eyes. Twenty years ago, renewable energy sources like wind and solar were expensive, inefficient, and generally avoided by the for-profit sector.
2020-08-27 07:28:05 - seekingalpha.com
The Retiree's Dividend Portfolio - John's July Update: The Roth IRA Shows Weakness

John's retirement accounts generated a total of $1,568.09 of dividend income for July 2020 vs. $1912.99 of dividend income for July of 2019.
2020-08-20 10:39:26 - seekingalpha.com
Utilities Dashboard For August
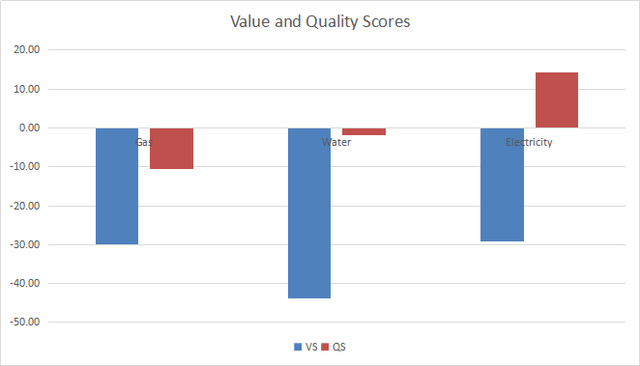
A dashboard with metrics of value, quality and momentum. Value and quality scores relative to historical averages.
2020-08-17 16:22:51 - seekingalpha.com
Why I'm Worrying Over A Market Drop
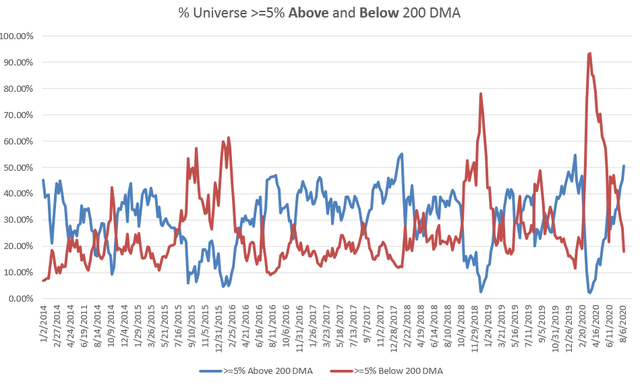
Our overbought indicator reaches rarefied air. It could be a good time to rein in risk by reducing margin and avoiding short-term calls.
2020-07-30 23:11:16 - seekingalpha.com
Vanguard Utilities ETF: The Current Low Rate Environment Should Support Its Higher Fund Price
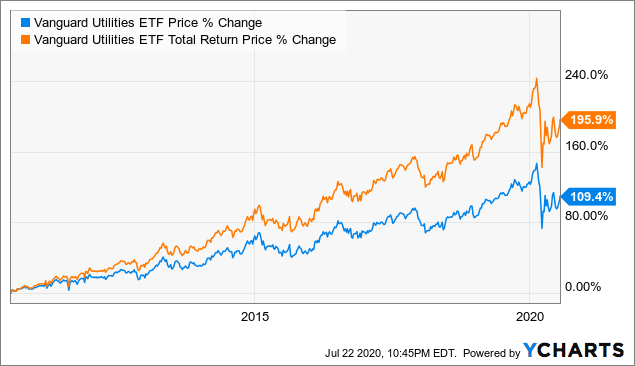
VPU invests in large-cap utility stocks in the U.S. Most stocks in VPU’s portfolio have not postponed their capital projects and will continue to invest in the next few years to grow their EPS and rate bases.
2020-07-13 12:54:56 - seekingalpha.com
Different Perspectives On The Success Or Failure Of Dominion Energy

Dominion Energy has one of the biggest US zero-carbon power generation investment programs. Part of the switch to renewables involves selling of gas transmission and storage assets and abandoning the Atlantic Coast Pipeline.
2020-06-30 08:21:51 - seekingalpha.com
The Retiree's Dividend Portfolio - John's May Update: Selling Kimco Preferred Series L For Better Opportunities
John's retirement accounts generated a total of $1,064.77 of dividend income for May 2020 vs. $1,115.93 of dividend income for May of 2019. John's Traditional I