Exchange: NYSE
Goldman Sachs ActiveBeta Price, Forecast, Insider, Ratings, Fundamentals & Signals
-0.02% $32.20
America/New_York / 8 mai 2024 @ 15:59
| FUNDAMENTALS | |
|---|---|
| MarketCap: | 933.10 mill |
| EPS: | 2.95 |
| P/E: | 10.92 |
| Earnings Date: | N/A |
| SharesOutstanding: | 28.98 mill |
| Avg Daily Volume: | 0.109 mill |
| PE RATIO: COMPANY / SECTOR |
|---|
| 0.46x |
| Company: PE 10.92 | sector: PE 23.85 |
| PE RATIO: COMPANY / INDUSTRY |
|---|
| 0.81x |
| Company: PE 10.92 | industry: PE 13.52 |
| DISCOUNTED CASH FLOW VALUE |
|---|
| N/A |
| N/A |
| Expected Trading Range (DAY) |
|---|
|
$ 31.90 - 32.50 ( +/- 0.93%) |
| ATR Model: 14 days |
Live Trading Signals (every 1 min)
10.00
Buy
Last version updated: Fri April 15th, 2022
| Indicator Signals | |
|---|---|
| RSI 21 | |
| SMA | |
| Trend | |
| Trend 2 | |
| Trend 3 | |
| MACD |
| Volume Signals | |
|---|---|
| Price | $32.20 (-0.02% ) |
| Volume | 0.0797 mill |
| Avg. Vol. | 0.109 mill |
| % of Avg. Vol | 73.24 % |
| Signal 1: | |
| Signal 2: |
Today
Last 12 Months
RSI
Last 10 Buy & Sell Signals For GEM
0 Signals | Accuracy: 0.00% | Accuracy Buy: 0.00% | Accuracy Sell: 0.00%
Avg return buy: 0.00 % | Avg return sell: 0.00 %
$1 invested is now $1.00 or 0.00% since Coming Soon
| Date | Signal | @ | Closed | % |
|---|

GEM
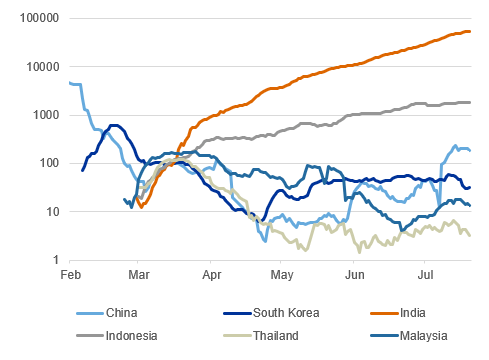
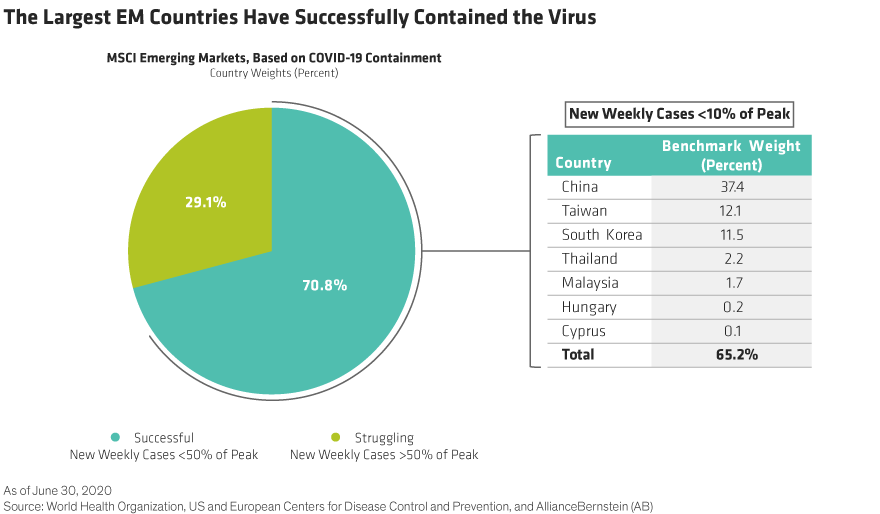
The index is designed to deliver exposure to equity securities of emerging market issuers. The fund invests at least 80% of its assets (exclusive of collateral held from securities lending) in securities included in its underlying index, in depositary receipts representing securities included in its underlying index and in underlying stocks in respect of depositary receipts included in its underlying index.
Latest News