Barclays Bank PLC iPath [GSP]
Exchange: NYSE
Barclays Bank PLC iPath Price, Forecast, Insider, Ratings, Fundamentals & Signals
0.00% $19.66
America/New_York / 7 jun 2023 @ 12:22
| FUNDAMENTALS | |
|---|---|
| MarketCap: | 17.37 mill |
| EPS: | 0 |
| P/E: | 0 |
| Earnings Date: | N/A |
| SharesOutstanding: | 0.884 mill |
| Avg Daily Volume: | 0 mill |
| PE RATIO: COMPANY / SECTOR |
|---|
| 0.00x |
| Company: PE 0 | sector: PE 23.85 |
| PE RATIO: COMPANY / INDUSTRY |
|---|
| N/A |
| Company: PE 0 | industry: PE 13.52 |
| DISCOUNTED CASH FLOW VALUE |
|---|
| N/A |
| N/A |
| Expected Trading Range (DAY) |
|---|
|
$ 19.32 - 19.99 ( +/- 1.70%) |
| ATR Model: 14 days |
Insider Trading
| Date | Person | Action | Amount | type |
|---|---|---|---|---|
| 2012-08-20 | Simmons Sabrina | Sell | 11 344 | Common Stock |
| INSIDER POWER |
|---|
| 0.00 |
| Last 1 transactions |
| Buy: 0 | Sell: 11 344 |
Forecast:
01:40 - $19.21
Live Trading Signals (every 1 min)
SCORE
10.00
Buy
10.00
Buy
Score Algorithm Version: 1.2C
Last version updated: Fri April 15th, 2022
Last version updated: Fri April 15th, 2022
| Indicator Signals | |
|---|---|
| RSI 21 | |
| SMA | |
| Trend | |
| Trend 2 | |
| Trend 3 | |
| MACD |
| Volume Signals | |
|---|---|
| Price | $19.66 (0.00% ) |
| Volume | 0.0003 mill |
| Avg. Vol. | 0 mill |
| % of Avg. Vol | 0 % |
| Signal 1: | |
| Signal 2: |
Today
Last 12 Months
RSI
Last 10 Buy & Sell Signals For GSP
0 Signals | Accuracy: 0.00% | Accuracy Buy: 0.00% | Accuracy Sell: 0.00%
Avg return buy: 0.00 % | Avg return sell: 0.00 %
$1 invested is now $1.00 or 0.00% since Coming Soon
| Date | Signal | @ | Closed | % |
|---|

GSP
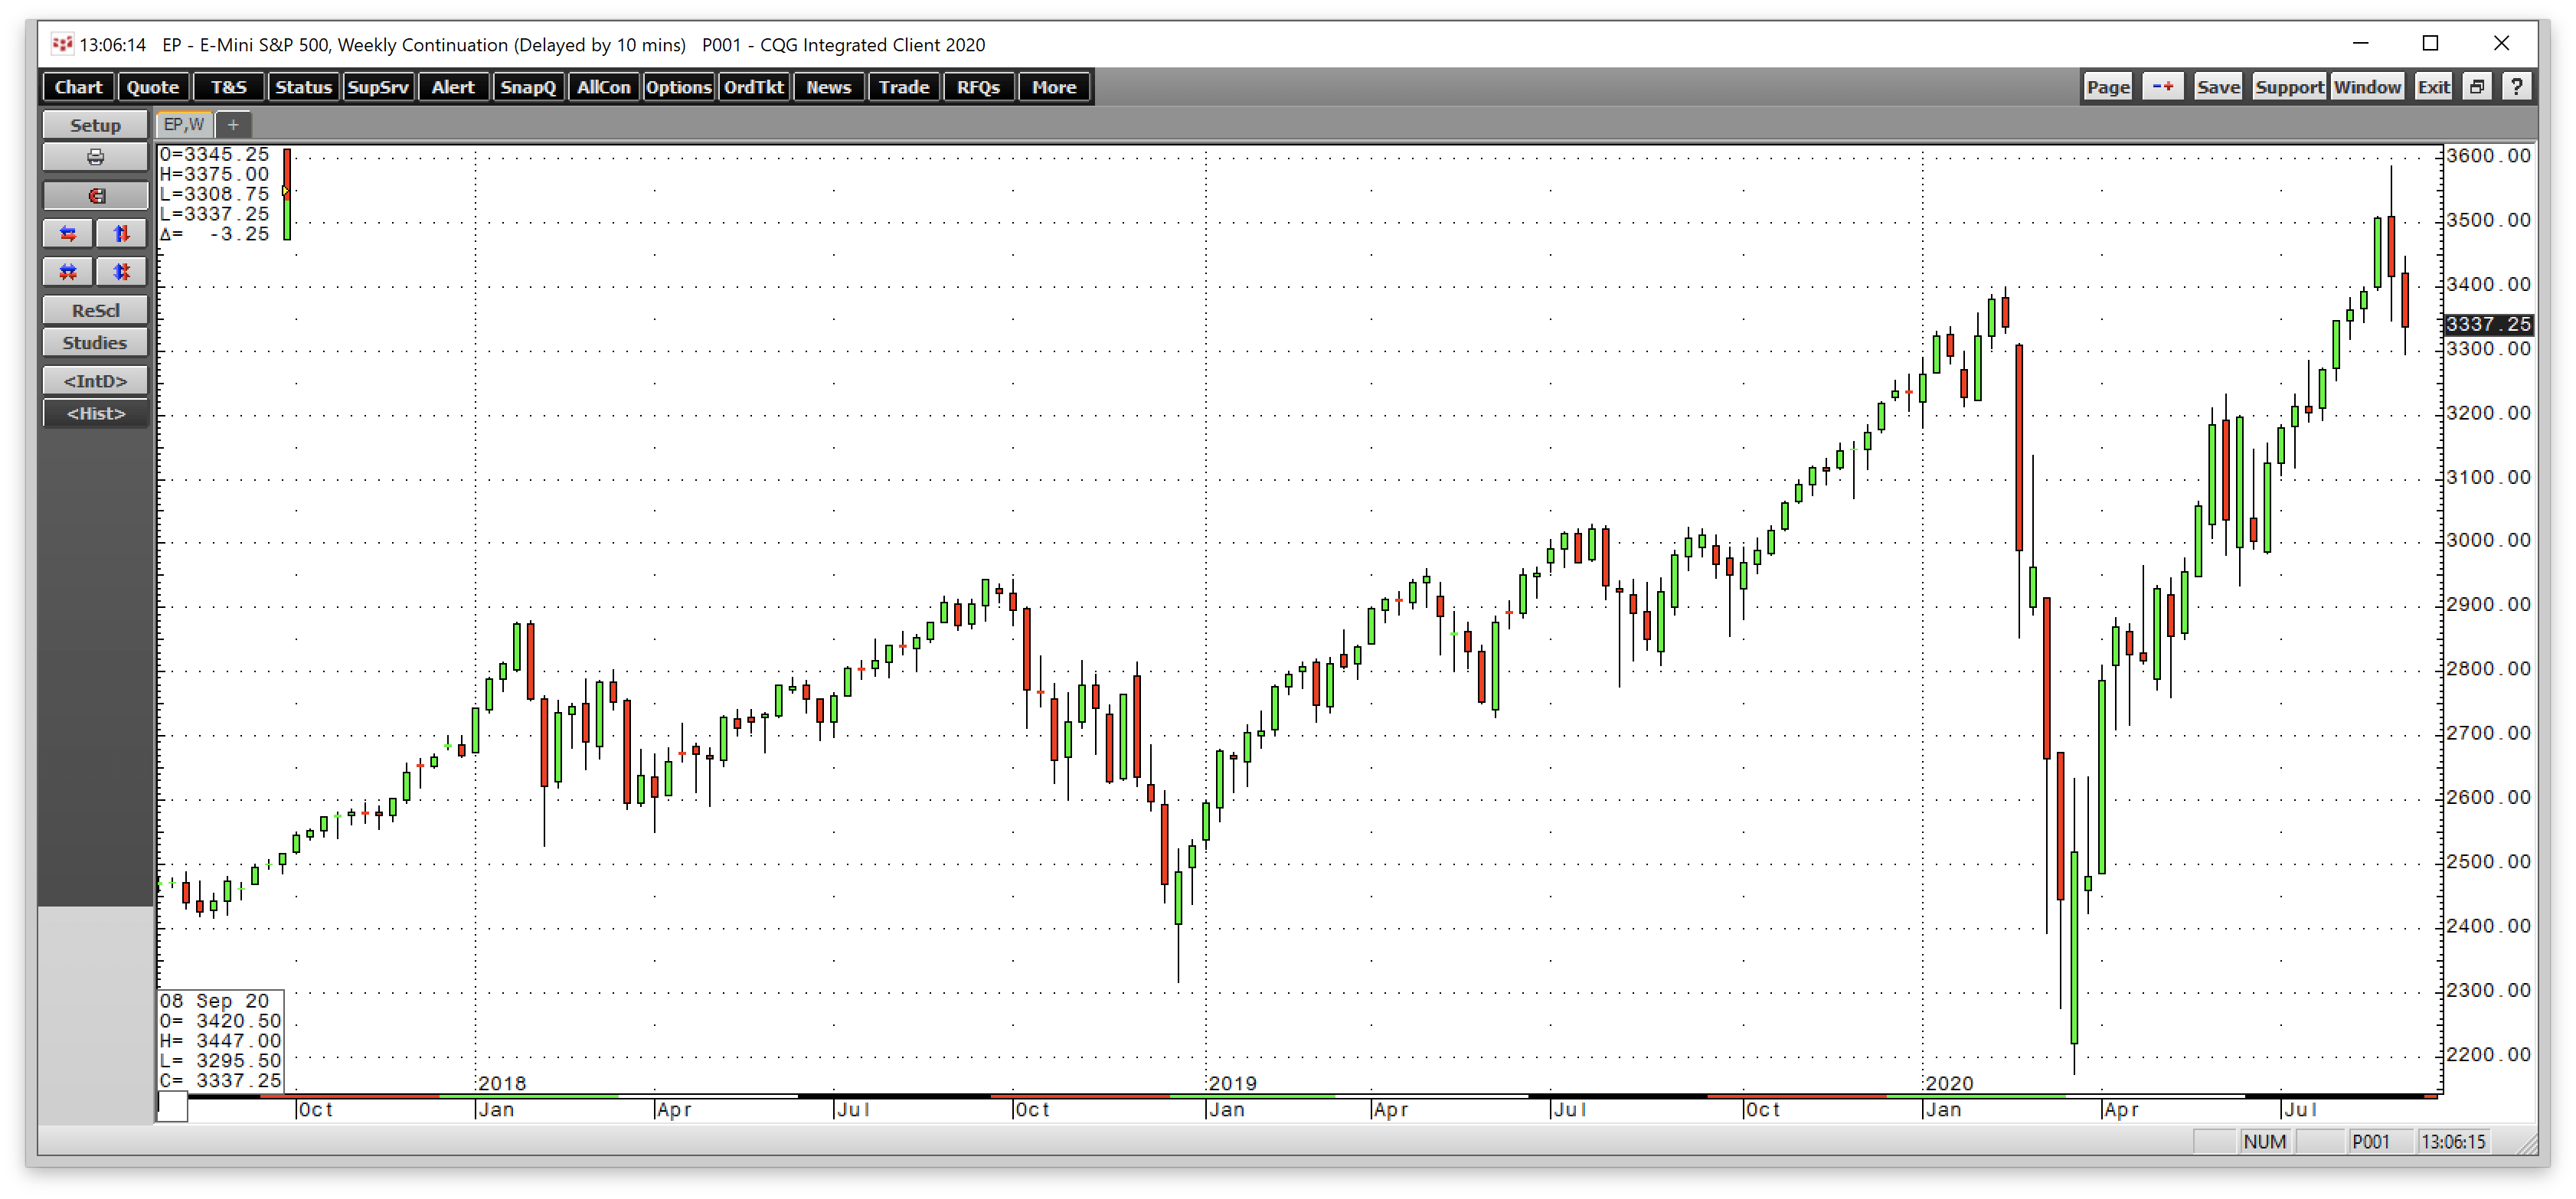
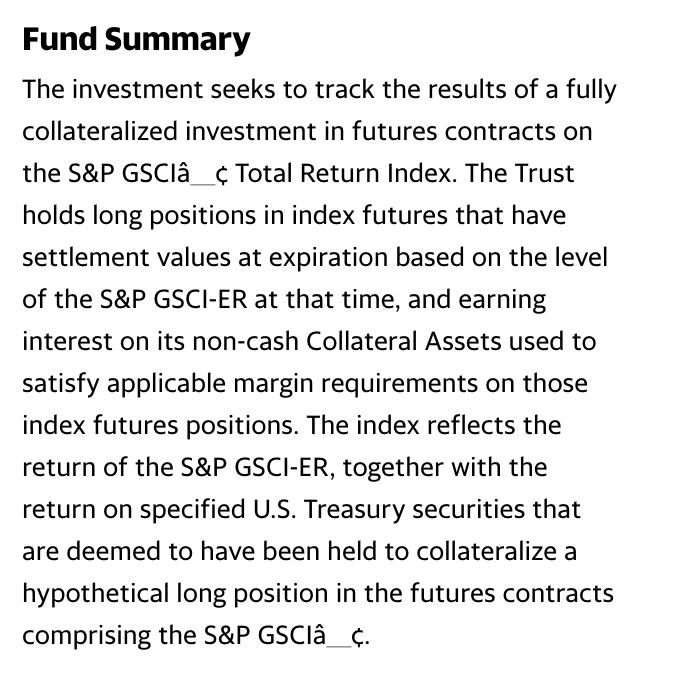
The S&P GSCI® Total Return Index provides exposure to the returns potentially available through an unleveraged investment in the contracts comprising the S&P GSCI® plus the Treasury Bill rate of interest that could be earned on funds committed to the trading of the underlying contracts.
Latest Press Releases
2022-08-26 02:00:00 - Press Release
Gensource Announces Date For Shareholder Update Call And Provides Global Fertilizer Market Update
Saskatoon, saskatchewan & london--(business wire)--gensource potash corporation (“gensource” or the “company”) (tsxv: gsp, aim: gsp) announces today its plans to host a shareholder update call for wednesday august 31, 2022 at 4:00 pm eastern time, during which the company will provide an update on the development of its potash project near tugaske, sk (the “tugaske project”), discuss next steps, current fertilizer market industry dynamics and respond to shareholder questions. the call is scheduled for 4:00 pm eastern time. participants can join the call by dialing: 1-844-534-3191. if shareholders would like any specific items addressed during the call, they should email questions in advance to: info@gensource...
2020-02-03 07:00:00 - Press Release
Gensource Announces Shareholder Update Conference Call
Saskatoon, saskatchewan--(business wire)--gensource potash corporation (“gensource” or the “company”) (tsx-v: gsp) today announced that the company will host its quarterly shareholder update call on february 5, 2020. the call is scheduled for 4:00 pm eastern standard time, and participants can join by dialing: 1-866-486-8901. if shareholders would like any specific items addressed during the call, they should email questions in advance to: info@gensource.ca the intent of the call is to continue gensource’s consistent quarterly calls, provide general information on the company’s activities for the past quarter and general status of the company’s projects as well as its efforts with respect to project financing...
2019-10-10 07:00:00 - Press Release
Gensource Announces Shareholder Update Conference Call
Saskatoon, saskatchewan--(business wire)--gensource potash corporation (“gensource” or the “company”) (tsx-v: gsp), today announced that the company will host its quarterly shareholder update call on october 22, 2019. the call is scheduled for 4:00 pm eastern standard time, and participants can join by dialing: 1-866-486-8901. for any specific items that shareholders would like addressed during the call, please email your questions in advance to: info@gensource.ca the regular call will provide an update on all activities of the company over the past quarter, focusing on the project financing process as outlined in the august 12, 2019 news release, as well as general discussion of the company’s next steps...
2019-06-13 17:15:00 - Press Release
Gensource Announces Shareholder Update Conference Call
Saskatoon, saskatchewan--(business wire)--gensource potash corporation (“gensource” or the “corporation”) (tsx-v: gsp) today announced that the company will host its quarterly shareholder update call on june 19, 2019. the call is scheduled for 4:00 pm eastern standard time, and participants can join by dialing: 1-866-486-8901. for any specific items that shareholders would like addressed during the call, please email your questions in advance to: info@gensource.ca. the intent of the call is to continue gensource’s consistent quarterly calls, providing general information on the company activities for the past quarter and general status of the company’s projects as well as its efforts with respect to project financing...
2019-02-11 07:00:00 - Press Release
Gensource Announces Shareholder Update Conference Call
Saskatoon, saskatchewan--(business wire)--gensource potash corporation (“gensource” or the “corporation”) (tsx-v: gsp) today announced that the company will host its quarterly shareholder update call on february 13, 2019. the call is scheduled for 4:00pm eastern standard time, and participants can join by dialing: 1-866-486-8901. for any specific items that shareholders would like addressed during the call, please email your questions in advance to: info@gensource.ca the intent of the call is to continue gensource’s consistent quarterly calls, providing general information on the company activities for the past quarter and general status of the company’s projects as well as its efforts with respect to project financing...
Latest News
2022-09-13 09:02:09 - Zacks Investment Research
5 Reasons to Buy Commodities ETFs Right Now

After a decade of underperformance, commodities are experiencing a huge rally due to the Russia-Ukraine war, sky-high inflation, pent-up demand after the COVID-19 pandemic and widespread vaccination.
2022-03-29 17:42:35 - ETFcom
Best Performing Commodity ETFs Of The Year

2022-03-09 09:02:05 - Zacks Investment Research
More Rally for Commodity ETFs in the Cards?

Russia is on its way to ban commodity exports as retaliation to Western sanctions. This is going to prolong the commodity market rally.
2021-07-15 01:49:46 - ETFcom
Worst Performing ETFs Of The Year

2021-07-01 11:15:34 - Seeking Alpha
GSG: A Short-To-Medium Term Play ETF

2020-09-14 12:43:15 - seekingalpha.com
Oil Falls But No Real Signs Of Risk-Off In Commodities
2020-09-08 10:11:53 - seekingalpha.com
Financing Challenges Are Another Reason Why Commodity Prices Should Head Higher
2020-09-02 00:21:46 - seekingalpha.com
Fed's Inflation Memo Sparked A New Leg Of The Rally: Greer
The Fed’s “inflation running hot” memo has created a pivotal point in the market rally, and the resulting asset price inflation is exactly what the Fed intended.
2020-08-27 05:50:44 - seekingalpha.com
Weekly Pricing Pulse: Continuing Signs Of Recovery Lifts Commodities
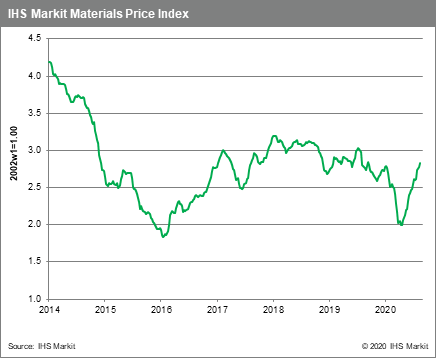
The rise in prices highlighted by the four-month rally in our Materials Price Index does indicate the worst of the recession globally is over.
2020-08-26 07:47:04 - seekingalpha.com
Seasonality In Commodities- Natural Gas And Heating Oil Versus Meats, Grains, And Gasoline
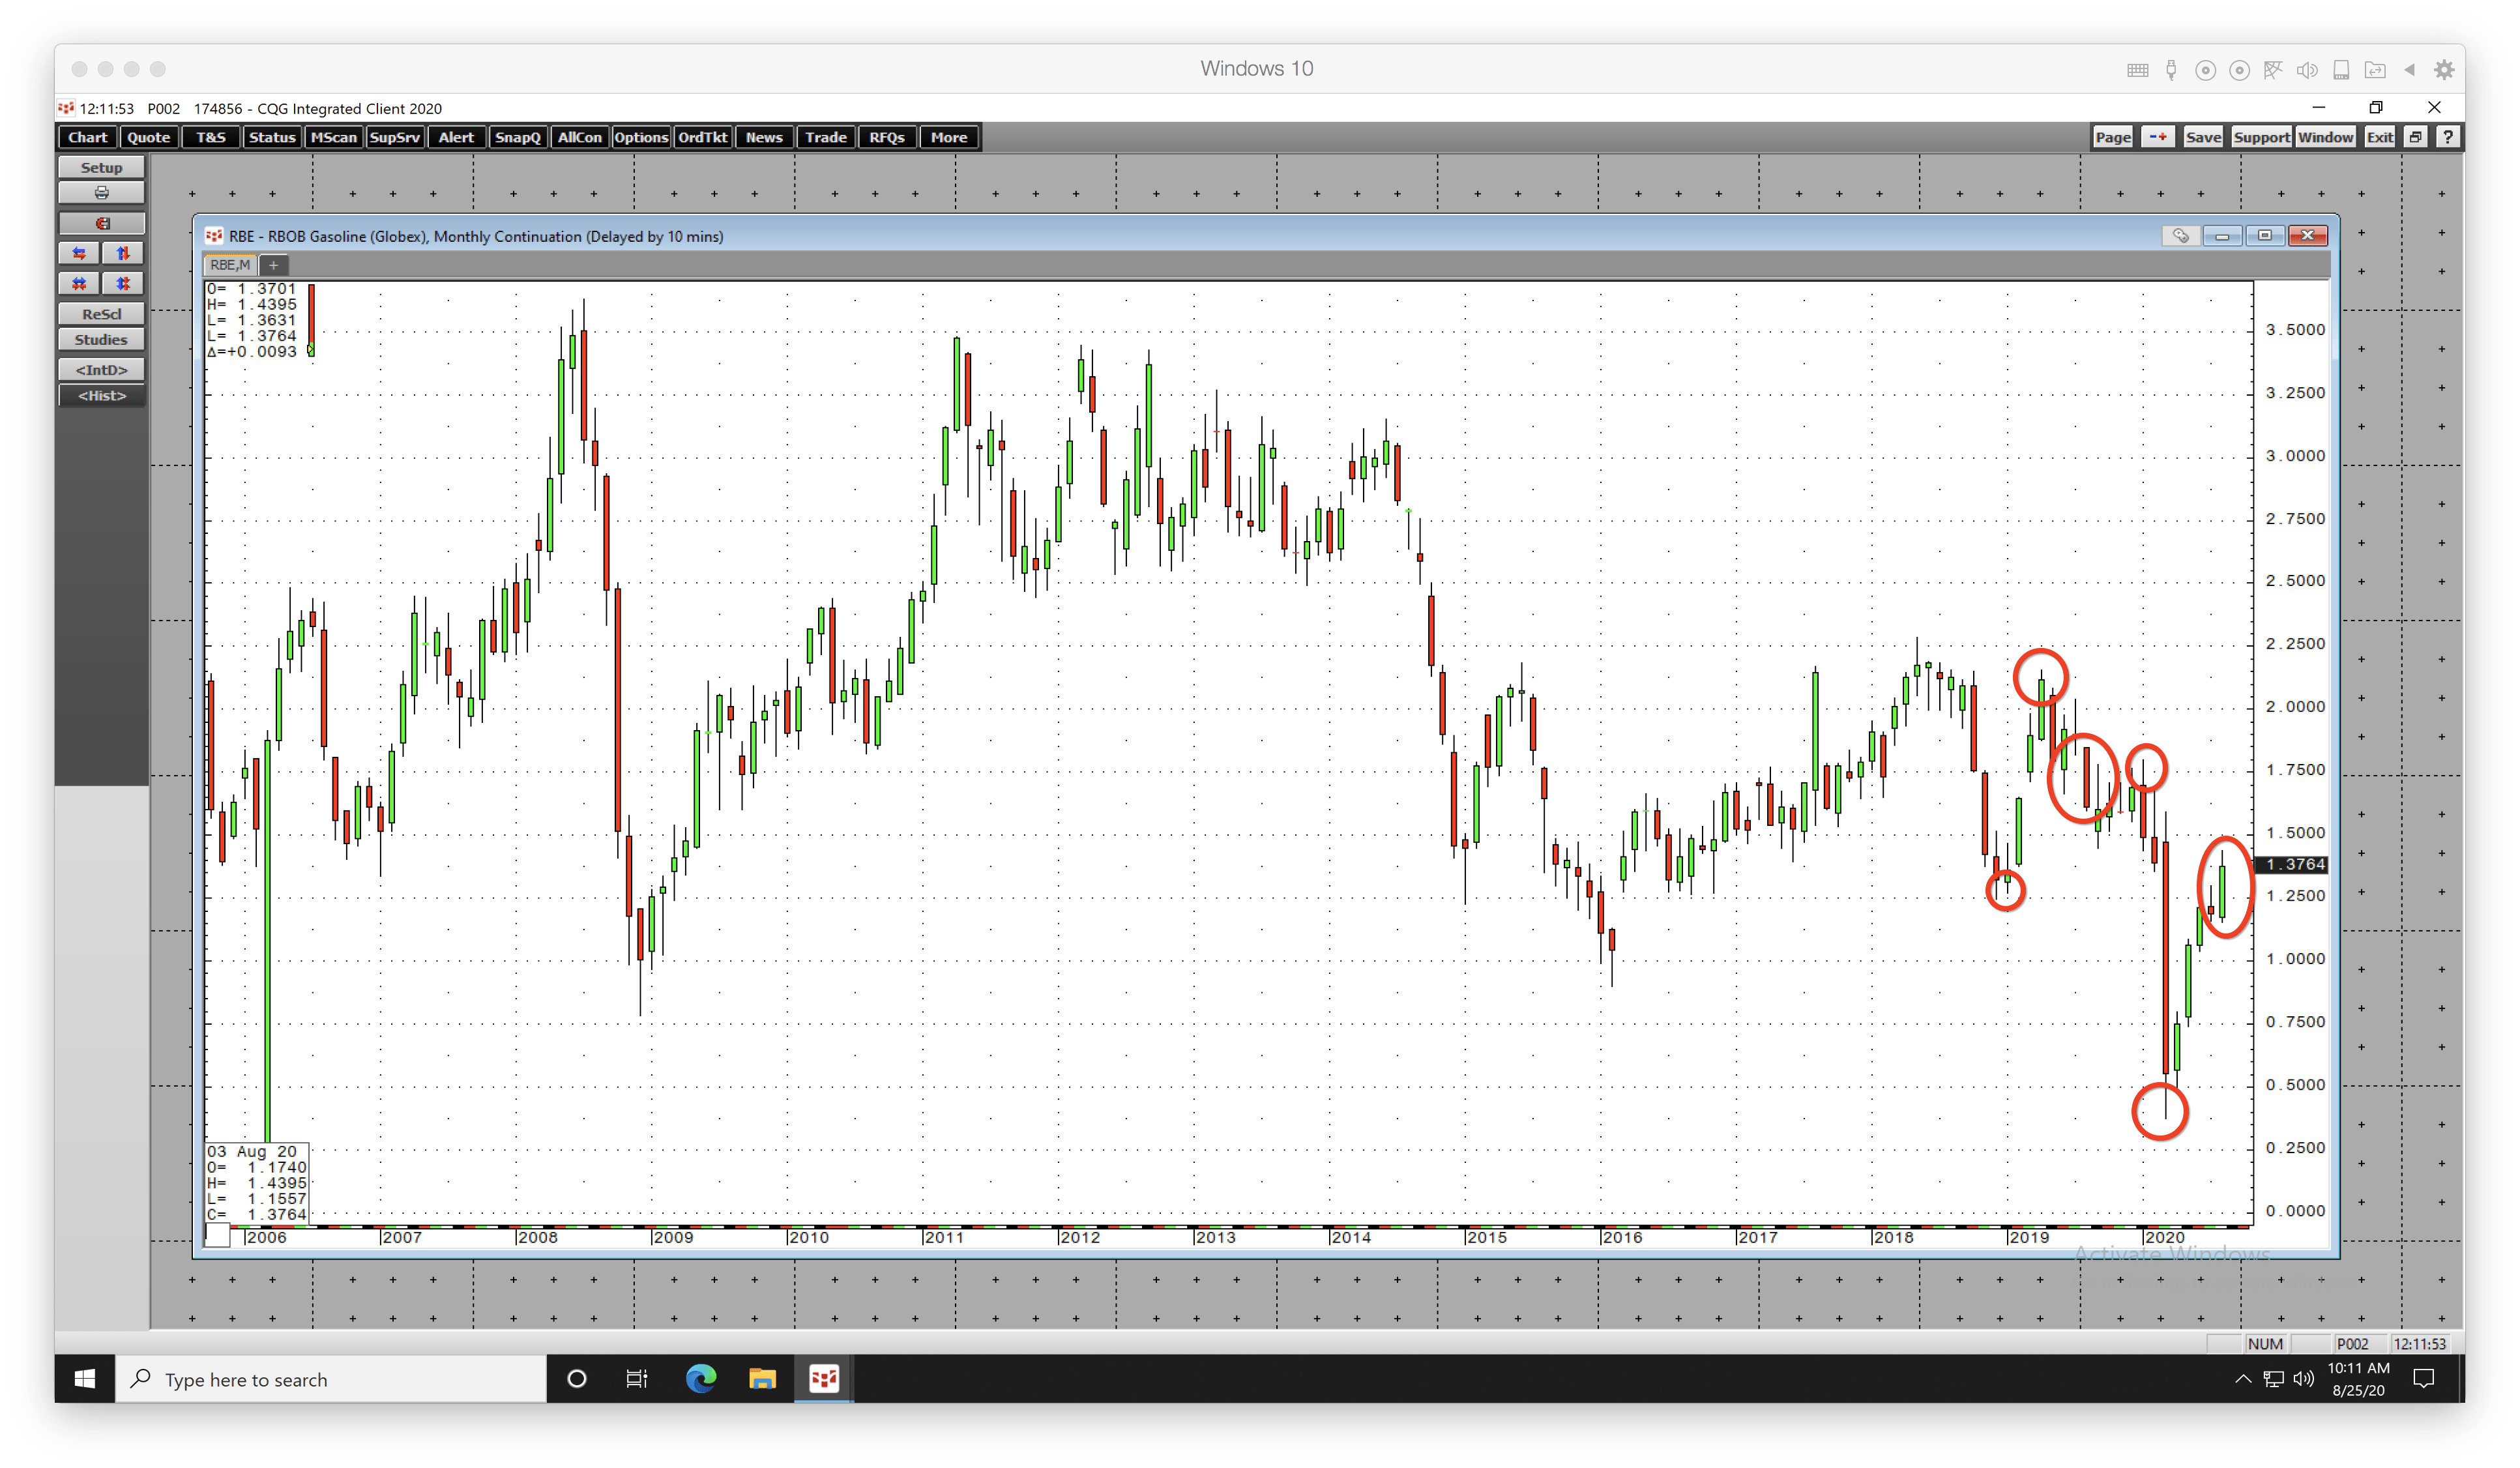
The winter is coming fast- the offseason for meats and gasoline. The withdrawal season for natural gas is on the horizon.