Exchange: NYSE
PIMCO Equitiy Series RAFI Price, Forecast, Insider, Ratings, Fundamentals & Signals
-0.02% $20.06
America/New_York / 9 mai 2024 @ 11:22
| FUNDAMENTALS | |
|---|---|
| MarketCap: | 96.34 mill |
| EPS: | 2.47 |
| P/E: | 8.13 |
| Earnings Date: | N/A |
| SharesOutstanding: | 4.80 mill |
| Avg Daily Volume: | 0.0106 mill |
| PE RATIO: COMPANY / SECTOR |
|---|
| 0.34x |
| Company: PE 8.13 | sector: PE 23.85 |
| PE RATIO: COMPANY / INDUSTRY |
|---|
| 0.60x |
| Company: PE 8.13 | industry: PE 13.52 |
| DISCOUNTED CASH FLOW VALUE |
|---|
| N/A |
| N/A |
| Expected Trading Range (DAY) |
|---|
|
$ 19.90 - 20.22 ( +/- 0.81%) |
| ATR Model: 14 days |
Live Trading Signals (every 1 min)
10.00
Buy
Last version updated: Fri April 15th, 2022
| Indicator Signals | |
|---|---|
| RSI 21 | |
| SMA | |
| Trend | |
| Trend 2 | |
| Trend 3 |
| Volume Signals | |
|---|---|
| Price | $20.06 (-0.02% ) |
| Volume | 0.0032 mill |
| Avg. Vol. | 0.0106 mill |
| % of Avg. Vol | 30.06 % |
| Signal 1: | |
| Signal 2: |
Today
Last 12 Months
RSI
Last 10 Buy & Sell Signals For MFEM
0 Signals | Accuracy: 0.00% | Accuracy Buy: 0.00% | Accuracy Sell: 0.00%
Avg return buy: 0.00 % | Avg return sell: 0.00 %
$1 invested is now $1.00 or 0.00% since Coming Soon
| Date | Signal | @ | Closed | % |
|---|

MFEM
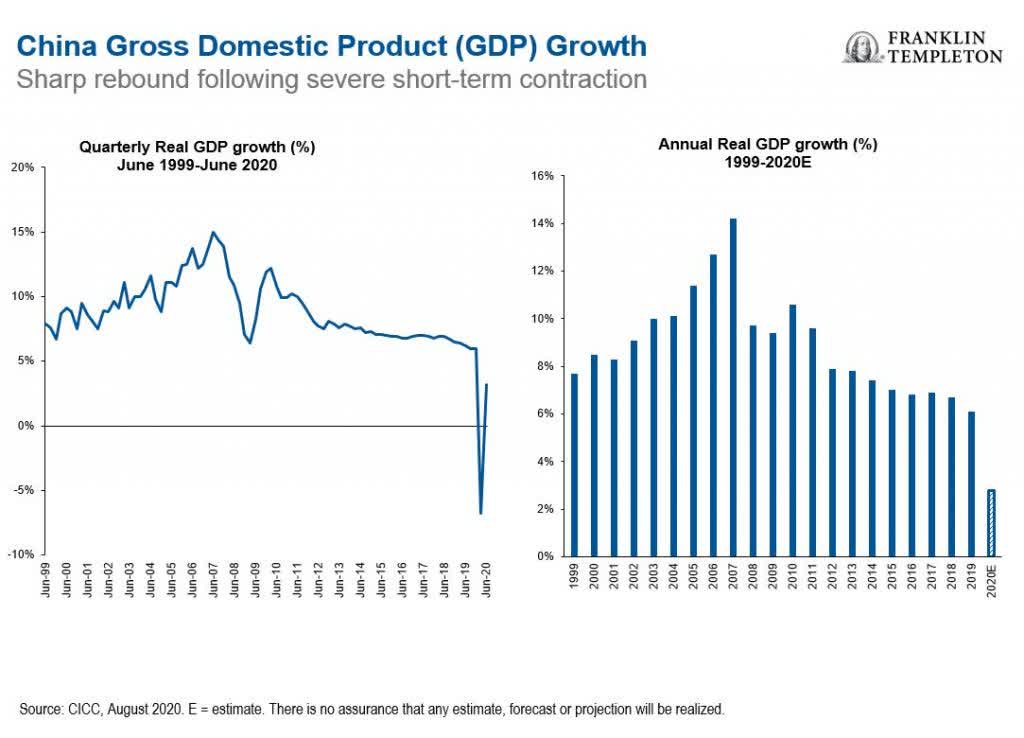
The fund seeks to achieve its investment objective by investing at least 80% of its total assets (exclusive of collateral held from securities lending) in the component securities of the RAFI Dynamic Multi-Factor Emerging Markets Index. The underlying index is constructed by RAFI Indices, LLC using a rules-based approach to construct factor portfolios within the underlying index. The underlying index consists of "factor portfolios," each of which emphasizes one of the following factors: value, low volatility, quality and momentum.
Latest News