ClearShares Ultra-Short [OPER]
Exchange: NYSE
ClearShares Ultra-Short Price, Forecast, Insider, Ratings, Fundamentals & Signals
0.03% $100.29
America/New_York / 8 mai 2024 @ 15:59
| FUNDAMENTALS | |
|---|---|
| MarketCap: | 165.33 mill |
| EPS: | 0 |
| P/E: | 0 |
| Earnings Date: | N/A |
| SharesOutstanding: | 1.649 mill |
| Avg Daily Volume: | 0.0151 mill |
| PE RATIO: COMPANY / SECTOR |
|---|
| 0.00x |
| Company: PE 0 | sector: PE 23.85 |
| PE RATIO: COMPANY / INDUSTRY |
|---|
| N/A |
| Company: PE 0 | industry: PE 13.52 |
| DISCOUNTED CASH FLOW VALUE |
|---|
| N/A |
| N/A |
| Expected Trading Range (DAY) |
|---|
|
$ 100.22 - 100.36 ( +/- 0.07%) |
| ATR Model: 14 days |
Forecast:
16:00 - $100.29
Live Trading Signals (every 1 min)
Forecast
1: 16:00 - $100.29
Forecast 2: 16:00 - $100.29
Forecast 3: 16:00 - $100.29
SCORE
10.00
Buy
10.00
Buy
Score Algorithm Version: 1.2C
Last version updated: Fri April 15th, 2022
Last version updated: Fri April 15th, 2022
| Indicator Signals | |
|---|---|
| RSI 21 | |
| SMA | |
| Trend | |
| Trend 2 | |
| Trend 3 | |
| MACD |
| Volume Signals | |
|---|---|
| Price | $100.29 (0.03% ) |
| Volume | 0.0117 mill |
| Avg. Vol. | 0.0151 mill |
| % of Avg. Vol | 77.69 % |
| Signal 1: | |
| Signal 2: |
Today
Last 12 Months
RSI
Last 10 Buy & Sell Signals For OPER
0 Signals | Accuracy: 0.00% | Accuracy Buy: 0.00% | Accuracy Sell: 0.00%
Avg return buy: 0.00 % | Avg return sell: 0.00 %
$1 invested is now $1.00 or 0.00% since Coming Soon
| Date | Signal | @ | Closed | % |
|---|

OPER
The fund is an actively-managed exchange-traded fund ("ETF") that seeks to achieve its investment objective primarily by investing in repurchase agreements collateralized by U.S. government securities and, to a lesser extent, directly in individual fixed income instruments. It is not a money market fund and does not seek to maintain a stable net asset value ("NAV") of $1.00 per share.
Latest News
2023-08-15 11:00:00 - Seeking Alpha
Selling Time? Oil, Inflation, Debt Concerns And A T-Bill Portfolio

The market is showing signs of weakness and lacks sustainable upside momentum. The recent sell-off has broken key moving averages, indicating a potential shift in market sentiment.
2023-05-17 04:27:21 - Seeking Alpha
OPER: When Repo Yields More Than T-Bills

The ClearShares Ultra-Short Maturity ETF is a fixed-income exchange-traded fund. This fund has a very interesting structure by lending money in the institutional money markets as opposed to owning securities.
2022-07-01 14:37:03 - Zacks Investment Research
Best Fixed-Income ETFs of 1H22

Some interest-protected bonds have managed to fare better than the regular bond ETFs in the first half of 2022.
2020-09-15 02:10:00 - seekingalpha.com
Why We Stay Moderately Pro-Risk
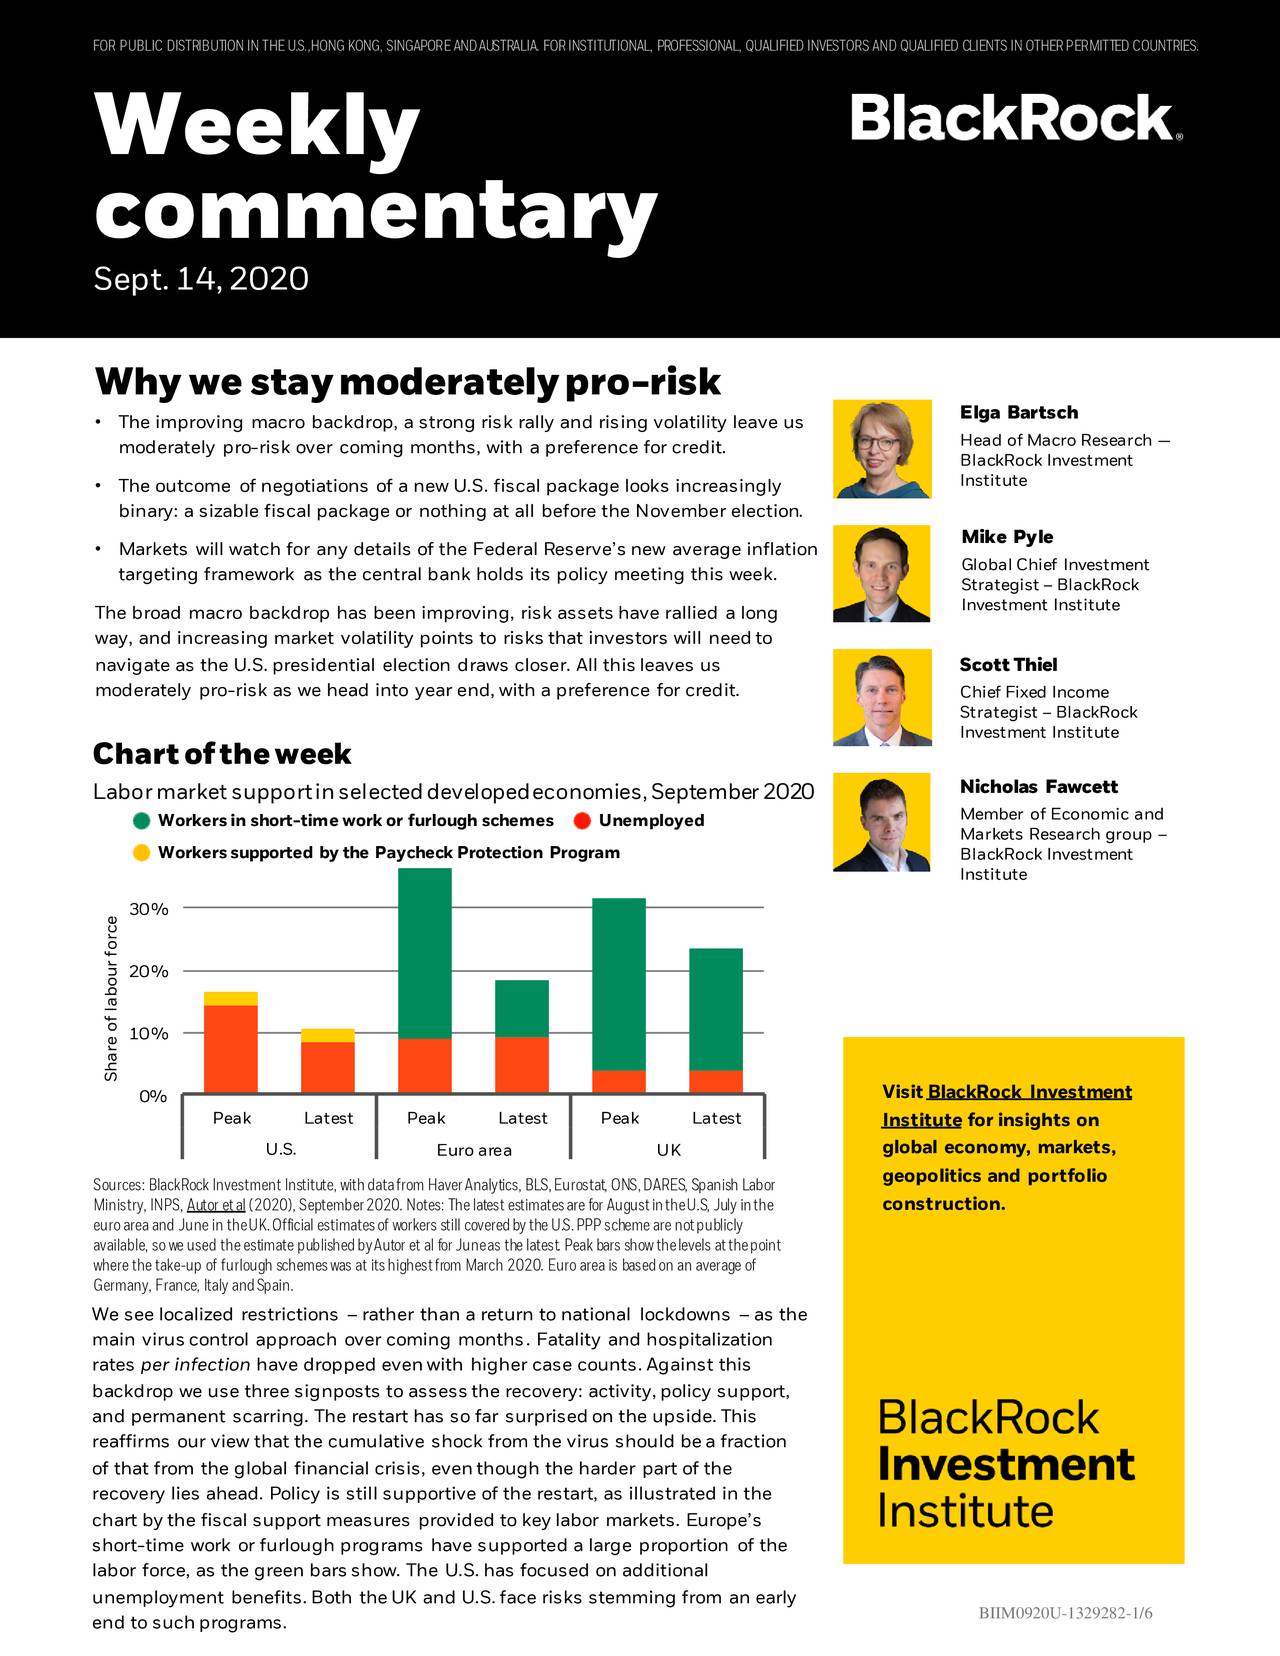
The improving macro backdrop, a strong risk rally and rising volatility leave us moderately pro-risk over coming months, with a preference for credit.
2020-09-12 09:56:43 - seekingalpha.com
Consumer Price Index: August Core At 1.74%
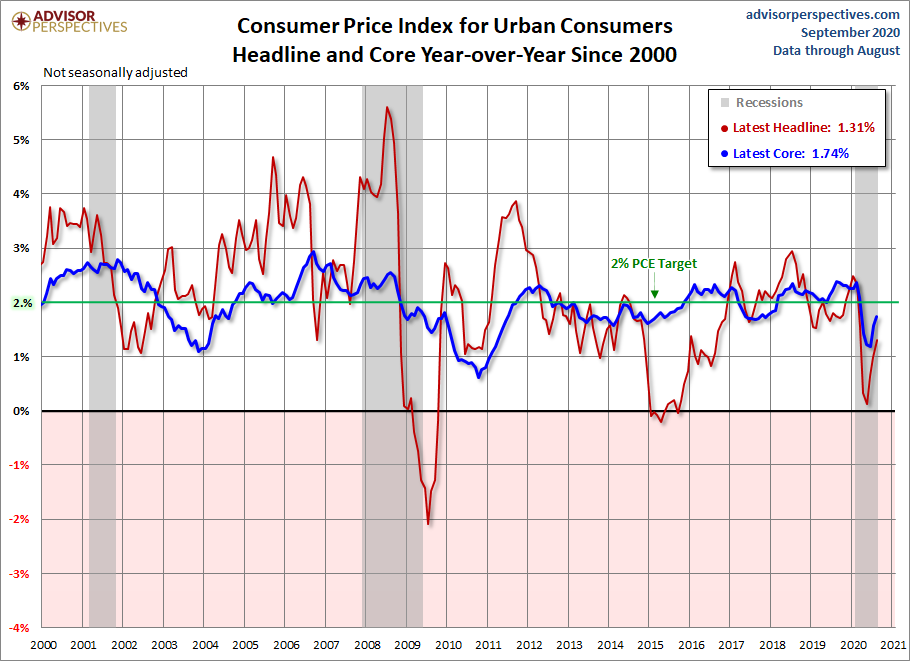
The Bureau of Labor Statistics released the August Consumer Price Index data this morning (Sept. 11).
2020-09-11 05:36:50 - seekingalpha.com
Fear And Inflation Components Are In Harmony For Gold
Fear factor is still strong and in favor of gold as investors fear a second shutdown. Inflation expectations are on the rise, further boosting gold's prospects.
2020-09-11 01:19:25 - seekingalpha.com
What Goes Up Has Definitely Been Coming Down
New hiring has now recouped nearly 50% of the total job losses that occurred during March and April. The unemployment rate shrank 1.8 percentage points in August, falling to 8.4%.
2020-09-11 00:42:36 - seekingalpha.com
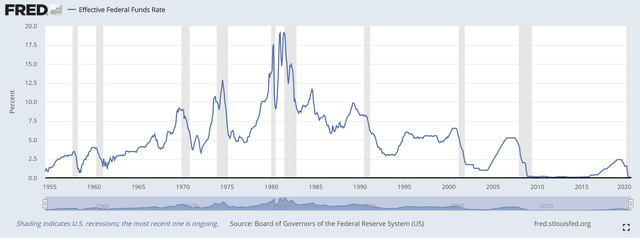
Fed's New Policy Risks 1970s Rerun
The Fed's new average inflation targeting policy is moot if inflation stays low. But if average inflation rises above the target, the central bank may find itself well behind the curve.
2020-09-09 08:04:44 - seekingalpha.com
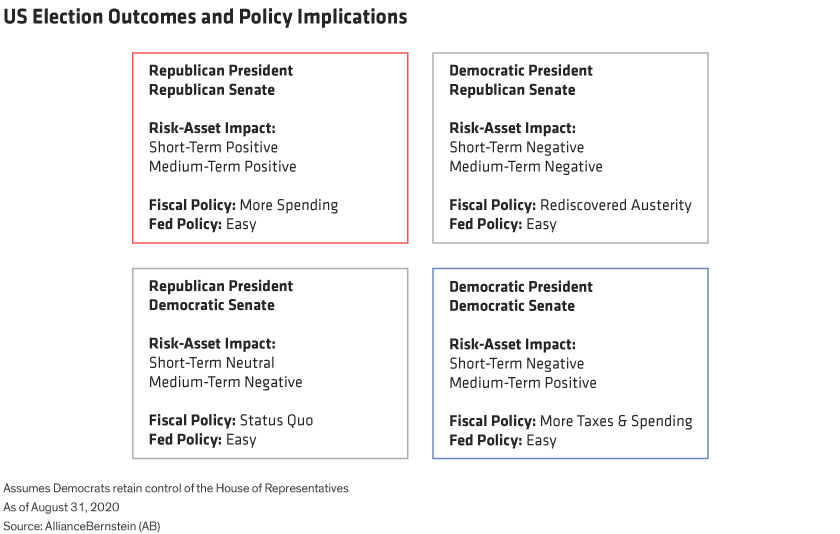
2020 U.S. Election: What The Polls Could Mean For Policy And Markets
The ongoing COVID-19 crisis and resulting policy responses will likely make this election result more meaningful than normal.
2020-09-09 06:38:50 - seekingalpha.com
A Cyclical Rotation In Corporate Credit
The sudden stop to markets induced by COVID-19 caused a substantial repricing of credit risk globally, and central banks, treasuries, and ministries of finance around the world responded unequivocally.