Exchange: ETF
Aptus Defined Risk ETF Price, Forecast, Insider, Ratings, Fundamentals & Signals
0.02% $25.68
America/New_York / 1 mai 2024 @ 15:54
| FUNDAMENTALS | |
|---|---|
| MarketCap: | 451.08 mill |
| EPS: | 19.64 |
| P/E: | 1.310 |
| Earnings Date: | N/A |
| SharesOutstanding: | 17.57 mill |
| Avg Daily Volume: | 0.135 mill |
| PE RATIO: COMPANY / SECTOR |
|---|
| 0.00x |
| Company: PE 1.310 | sector: PE -6.11 |
| PE RATIO: COMPANY / INDUSTRY |
|---|
| 0x |
| Company: PE 1.310 | industry: PE -6.11 |
| DISCOUNTED CASH FLOW VALUE |
|---|
| N/A |
| N/A |
| Expected Trading Range (DAY) |
|---|
|
$ 25.50 - 25.86 ( +/- 0.71%) |
| ATR Model: 14 days |
Live Trading Signals (every 1 min)
10.00
Buy
Last version updated: Fri April 15th, 2022
| Indicator Signals | |
|---|---|
| RSI 21 | |
| SMA | |
| Trend | |
| Trend 2 | |
| Trend 3 | |
| MACD |
| Volume Signals | |
|---|---|
| Price | $25.68 (0.02% ) |
| Volume | 0.441 mill |
| Avg. Vol. | 0.135 mill |
| % of Avg. Vol | 327.43 % |
| Signal 1: | |
| Signal 2: |
Today
Last 12 Months
RSI
Last 10 Buy & Sell Signals For DRSK
0 Signals | Accuracy: 0.00% | Accuracy Buy: 0.00% | Accuracy Sell: 0.00%
Avg return buy: 0.00 % | Avg return sell: 0.00 %
$1 invested is now $1.00 or 0.00% since Coming Soon
| Date | Signal | @ | Closed | % |
|---|

DRSK
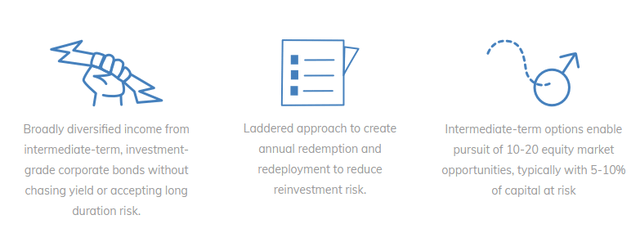
The fund is an actively managed exchange-traded fund ("ETF") that seeks to achieve its objective through a hybrid fixed income and equity strategy. It typically invests approximately 75% to 95% of its assets to obtain exposure to investment-grade corporate bonds (the "Fixed Income Strategy") and invests the remainder of its assets to obtain exposure to U.S. stocks, while limiting downside risk (the “Equity Strategy”).
Last 10 Buy Signals
Latest News