Exchange: ETF
Fidelity Targeted Price, Forecast, Insider, Ratings, Fundamentals & Signals
0.36% $24.84
America/New_York / 1 mai 2024 @ 15:11
| FUNDAMENTALS | |
|---|---|
| MarketCap: | 49.26 mill |
| EPS: | 3.12 |
| P/E: | 7.96 |
| Earnings Date: | N/A |
| SharesOutstanding: | 1.983 mill |
| Avg Daily Volume: | 0.0240 mill |
| PE RATIO: COMPANY / SECTOR |
|---|
| 0.00x |
| Company: PE 7.96 | sector: PE -6.11 |
| PE RATIO: COMPANY / INDUSTRY |
|---|
| 0x |
| Company: PE 7.96 | industry: PE -6.11 |
| DISCOUNTED CASH FLOW VALUE |
|---|
| N/A |
| N/A |
| Expected Trading Range (DAY) |
|---|
|
$ 24.55 - 25.13 ( +/- 1.18%) |
| ATR Model: 14 days |
Live Trading Signals (every 1 min)
10.00
Buy
Last version updated: Fri April 15th, 2022
| Indicator Signals | |
|---|---|
| RSI 21 | |
| SMA | |
| Trend | |
| Trend 2 | |
| Trend 3 | |
| MACD |
| Volume Signals | |
|---|---|
| Price | $24.84 (0.36% ) |
| Volume | 0.0186 mill |
| Avg. Vol. | 0.0240 mill |
| % of Avg. Vol | 77.84 % |
| Signal 1: | |
| Signal 2: |
Today
Last 12 Months
RSI
Last 10 Buy & Sell Signals For FDEM
0 Signals | Accuracy: 0.00% | Accuracy Buy: 0.00% | Accuracy Sell: 0.00%
Avg return buy: 0.00 % | Avg return sell: 0.00 %
$1 invested is now $1.00 or 0.00% since Coming Soon
| Date | Signal | @ | Closed | % |
|---|

FDEM
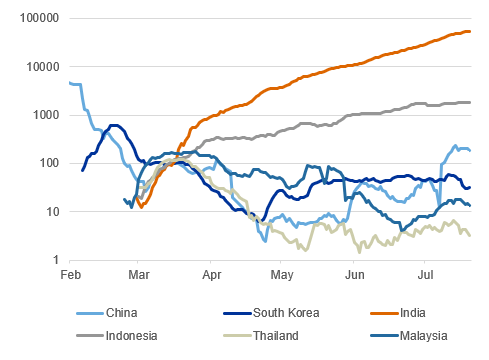
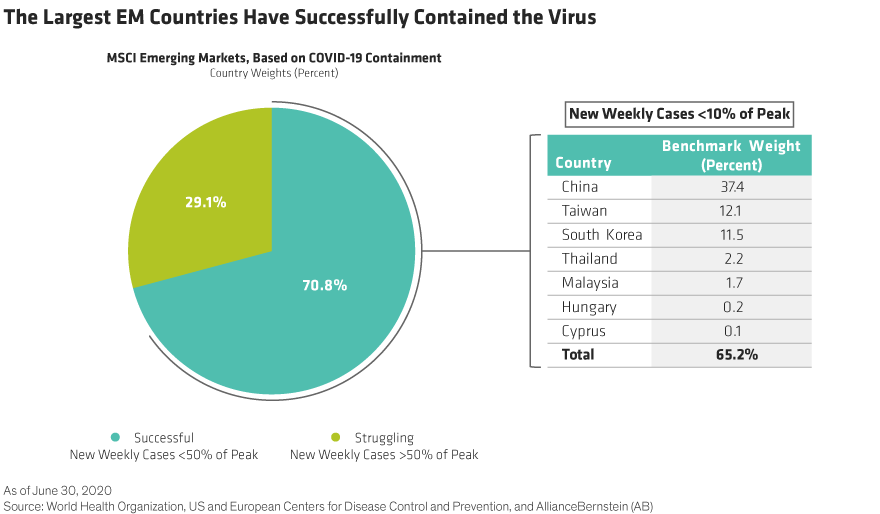
The fund normally invests at least 80% of its assets in securities included in the index and in depositary receipts representing securities included in the index. The index is designed to reflect the performance of stocks of large- and mid-capitalization emerging markets companies that have attractive valuations, high quality profiles, positive momentum signals, lower volatility than the broader emerging markets equity market, and lower correlation to the U.S. equity market.
Last 10 Buy Signals
Latest News